
Adding extra monitoring to your Citrix environment with Liquidware Stratusphere UX
Many of you of course know that Citrix Virtual Apps and Desktops come with Citrix Director monitoring tool built-in. But although Director is a good tool to see who is signed in, shadowing users, and getting session details, it is missing a lot of features when it comes to real performance monitoring, and doing drill down into performance issues. With the COVID situation that the world is in now; we are using more and more work from home solutions like Citrix. Making sure that everyone has great performance working in these environments is key to keep people productive in these hard times. Liquidware Stratusphere UX will give you, the system administrator, so many extra tools to monitor the environment and make sure that everyone can work safe, fast, and be productive.
Watch here as Chris Walker (sr. Solution Architect) shows the Top 5 performance problems and how to quickly identify them with Liquidware Stratusphere UX.
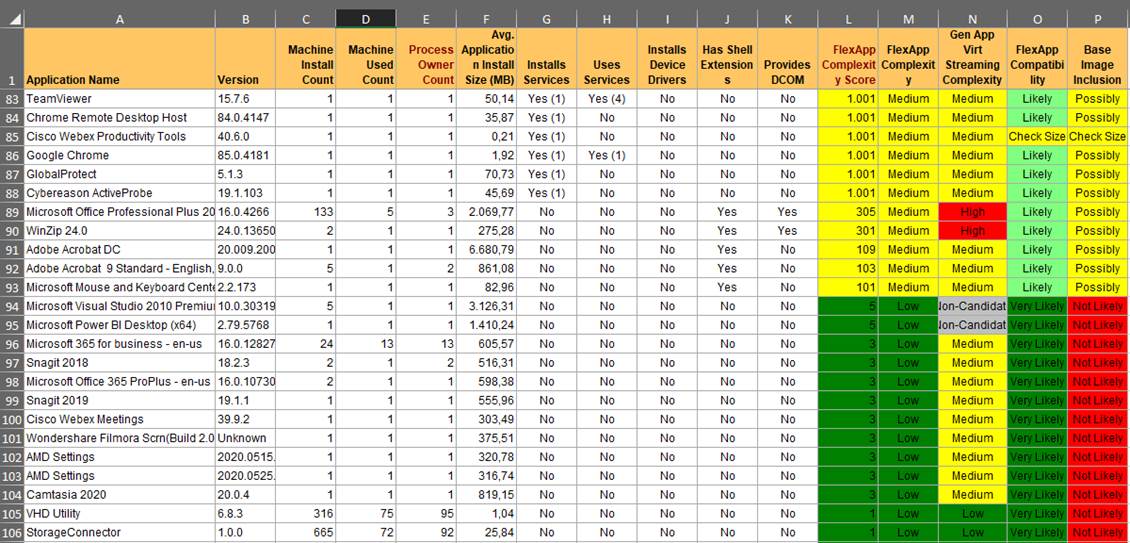
Before we go into individual features of Stratusphere UX, it is good to know that Stratusphere can collect monitoring data for a long time. Even for more than one year depending on sizing. This of course gives you a lot of data to troubleshoot and for baselining your performance. The data is also categorized in a Machine and Application inventory. here you can see all your applications, versions, usage data, and on which machines the applications are installed. It also gives you control over your application landscape and license management.
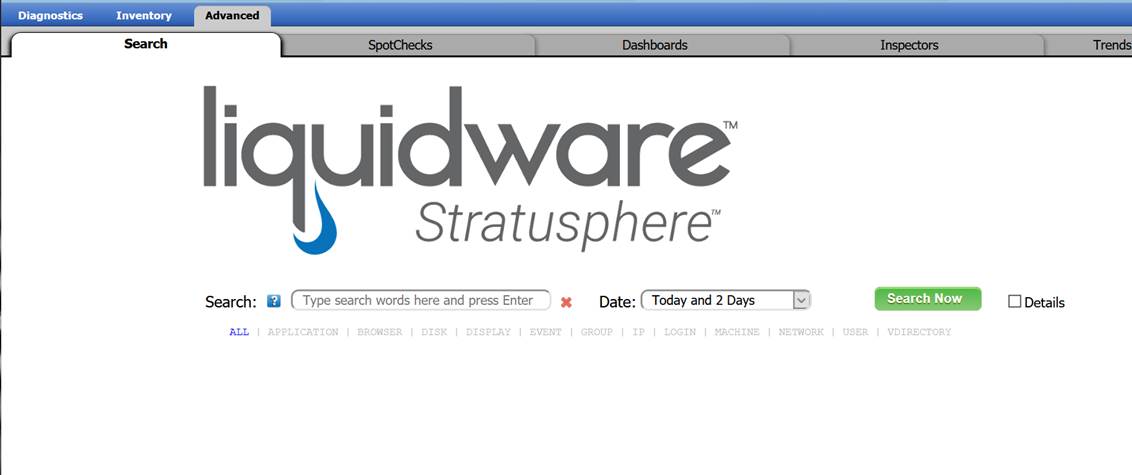
The console also lets you easily search the data. You can search for a user, machine, application, etc… Giving first- and second-line workers a great tool to get a 360-degree view of the environment. You can be completely up and running with Stratusphere UX in one hour. You can read my guide on how to install your instance here.
Login Breakdown
We all know that login times are a big deal when it comes to user performance. Well first off Stratusphere UX saves all your users logins from the last 30 days. So, if an end-user calls the helpdesk and says, “well last week my login was slow,” you can exactly go back to that date and see the login performance. Stratusphere UX also lets you go way deeper into the login process. It allows you to see exactly which GPO is taking the longest to process, which login process generated an error, or which profile folder took the longest to load. You can, of course, also compare to other users in the environment regarding the performance of the machines. Read more about login breakdown here.
User UX profile score
Stratusphere UX uses 11 metrics (tweakable by the system administrator) that are monitored over 7 days to create a performance baseline. When a user logs into the system they are automatically compared to that baseline and then are graded with a UX (user experience) score. This allows system administrators and helpdesk staff to directly see if a user is having a poor, fair, or good user experience.
Spotcheck
Stratusphere UX captures all performance data from users, hosts, and infrastructure. With all this data you can do powerful troubleshooting. Stratusphere comes with SpotCheck inspections. This function allows you to do a point-in-time inspection and see if your complete system is still healthy or if there are critical issues known or unknown. It allows you to set thresholds for the specific metrics you want to track in your environment which is even customizable with a filter. You can then use these metrics as a baseline. Then you can run the SpotCheck again to see if there are issues compared to your baselines. This delivers proactive performance monitoring and will help you stay ahead of any issues that have a negative user impact. Read more on SpotCheck here.
Custom Dashboards and easy export to Power BI
Stratusphere UX lets you create a custom monitoring dashboard. You can imagine that a helpdesk employee would like a dashboard with the Users UX scores to see how much CPU, RAM, and Pagefile the end-user is using. A system administrator might want a dashboard to see how much CPU and RAM the servers are using. Or better yet, seeing data in the Trends & Top Consumers dashboard. In this way, a system administrator can anticipate the performance needs of the environment. This visibility is all possible with Stratusphere UX. And not only this, you can extract all performance data and add it to your PowerBi dashboards. Click here to learn how to intergrade with PowerBi.
API
As you might know, I love automation. And when it comes to performance issues, I think that self-healing automation is the way to go. Because this does not require any human input, the end-user is helped sooner and hopefully would not even know there was a performance issue. But to automate and script self-healing solutions, for example, “start a disk cleaning when the system drive is 90% full,” or “create an extra WVD host when the machines in the host pool are all above 70% RAM,” we need accurate data to start with. Luckily Stratusphere UX captures all this data and you can easily get this data incorporated into your script with the Stratusphere API. I wrote a blog with PowerShell example on the API which you can read here. I think that the API-Builder that Stratusphere UX provides is the best in class performance API tool out there.
I hope this was informative. For questions or comments, you can always leave a reaction in the comment section or contact me: