ControlUp and Citrix NetScaler (ADC) integration
ControlUp delivers one of the best in class performance monitoring tools. And with script- actions it gives you the ability to automate extra tasks from within the console. You can read how to create these Script Actions in my blog here. But did you know that ControlUp also completely integrates with Citrix NetScaler ADC? It does this on three levels, one monitoring your appliance, two SBA’s and three NetScaler Reports. In this blog, we will go over these three integrations.
Monitoring Citrix NetScaler live performance
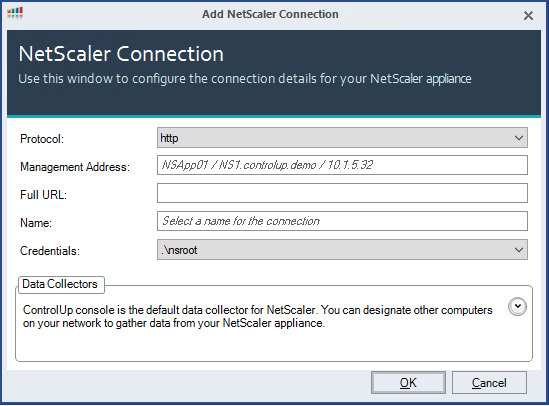
Within the ControlUp console, there is a button in the top ribbon to add a NetScaler. After clicking the add button the Add NetScaler connection screen will popup.

Here you will input your appliance management address and your credentials. And that’s it! you Now monitor your NetScaler.

You can directly see the CPU usage, RAM usage, Gateways/ Loadbalancers that are up. Here you also see how many users are connected with Citrix (HDX) sessions. Another handy statistic is how many days the running-config has not been saved. But there is a lot more! If you double click on your NetScaler you can go a level deeper and get statistics for your load balancers, LB services, LB service groups, HDX sessions, Gateways, STA’s and Nics.

For instance, in the gateway tab, you can see the connected users and how much traffic is being sent in and out by those users. It’s also handy that you can see the days until your Certificate expires on the gateway. All in all, this is a great way to monitor the performance of your NetScaler. But this is just the start, we can do a lot more with ControlUp NetScaler integration.
NetScaler Script Actions
As you might know, ControlUp allows the use of script actions with its monitored objects. It allows you to run a script on an object. And for the NetScaler it comes with a lot of built-in scripts you can use:
- Get NetScaler System Statistics
- Get NetScaler License Details
- Get NetScaler SSL Stats
- Retrieve NetScaler Connection information
- Retrieve NetScaler SSL vServer Bindings information
- Retrieve NetScaler Named Connection information
- Retrieve NetScaler LB Persistent Session information
- Retrieve NetScaler Content Switching information
- Retrieve NetScaler LB Persistent Session information with Geo
- Match NetScaler MAC address with License Hostname
- Retrieve NetScaler Content Switching Binding information
- Delete NetScaler License File
- Get NetScaler Hardware Information
- Run Citrix ADC HA Health check
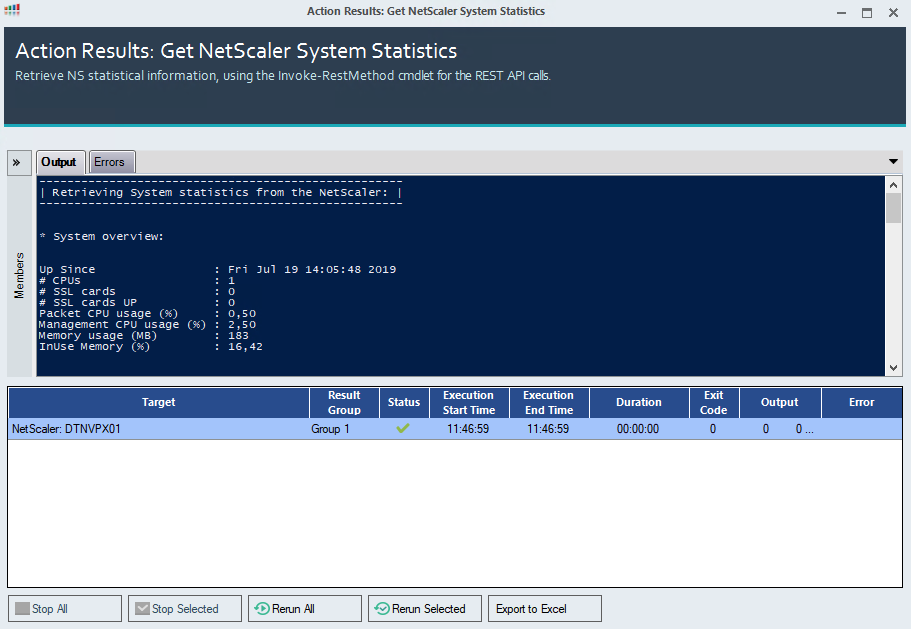
To use one of these functions the only thing you need to do is click right mouse on the NetScaler you want to run the script on. Then go to Script actions and click on an action. It will ask you to download the action and allow it to be added to your library. After that, you fill in your NetScaler credentials and the script will run (using PowerShell and NITRO). Here you can see my output on getting NetScaler System Statistics:

Of course, you can also create your own PowerShell script and add this as an Script Action. To read more about the NetScaller Script Actions click here.
ControlUp NetScaler ADC Reports
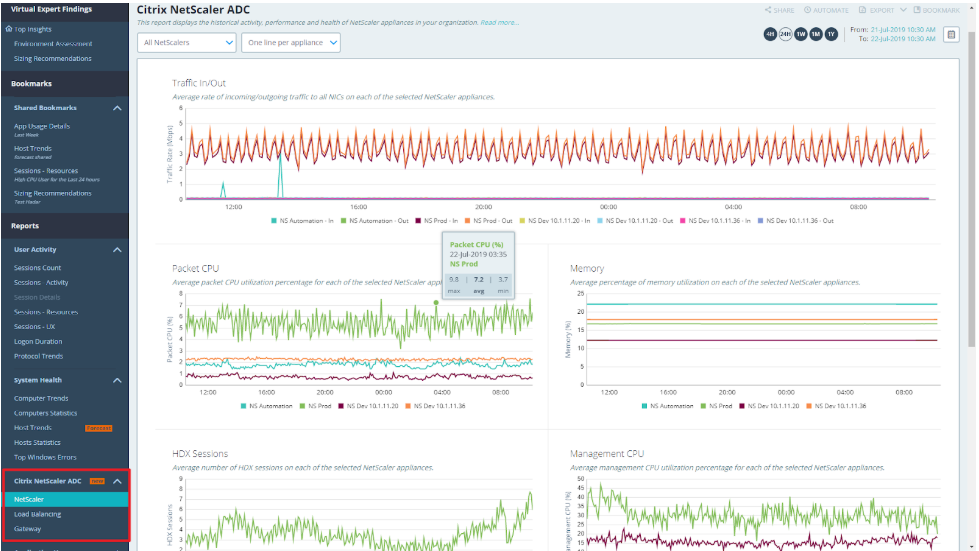
NetScaler reports are part of ControlUp insight. With ControlUp insight you get the ability to view historical trends in your environment. For instance, a user had performance issues today but also one week ago. ControlUp Insights is a full blown analytics platformyou’re your EUC enviorment you can read about it here and here. With insights, you can pull up the performance of this user from a week ago and compare it to the ones from today and easily find if there is a correlation. Recently the guys at ControlUp added few NetScaler related Reports to the ControlUp Insight portal. With NetScaler reports you can quickly find the answers to questions such as these:
- Which NetScalers ADC appliances were available during the selected time period?
- Are enough NetScalers ADC appliances deployed in the organization for our current load?
- Does NetScaler ADC appliance X have a powerful enough CPU for its workload?
- Is the workload shared evenly among the organization’s NetScaler ADC appliances?
- Were there any configuration changes on my NetScaler ADC Appliances and when did they occur?
- Is NetScaler ADC appliance X itself causing bottlenecks?
And the complete report is presented to you as an easy to read the graphical output.

It also allows you to go deeper into your Load balancers and Gateways. This will help you with questions like:
- Should we add more capacity to serve the requests coming to the Load Balancers?
- Are the Load Balancers dividing the load among the virtual servers optimally?
- How many users does Gateway X usually handle during a selected time period?
- How responsive are the gateways to my user requests? Are there delays at specific times?
Click here to read more about NetScaler reports. This is a great feature and will help companies to use their NetScaler optimal.
In conclusion, I don’t think there is a better set of tools out there to monitor, manage and size your NetScaler environment than ControlUp. https://www.controlup.com/
I hope this was informative. For questions or comments you can always give a reaction in the comment section or contact me:
