
OPTIMIZERS: VMware VS Citrix!
 Maybe you have noticed it: using an optimizer is all the rage today in the server virtualization landscape. At the moment there are two big companies who both have beta’s of optimizers. These are the Citrix Optimizer and the VMware OS Optimization Tool. Both are free to use and use templates to optimize your machine. In this blog I will test both optimizers and give you the pros and cons. And maybe we will find that there is a third way.
*Versions used in this blog: Citrix Optimizer 1.0.0.19 and VMware OS Optimization Tool b_1093
Index
Why use an Optimizer
Citrix Optimizer
VMware OS Optimization Tool (OSOT)
Testing
Testing XenApp
Results XenApp
Testing XenDesktop (VDI)
Results XenDesktop (VDI)
Why not both?
Conclusion
 Because Windows Server OS can be used for many roles and features and can be installed on a virtual or physical server. That’s why Microsoft adds a lot of services and register settings to make it as flexible as possible. But since we’re going to use the OS virtual and as a XenApp host there are a lot of services and settings we don’t need. By disabling all these services and settings we create a faster and leaner XenApp server. Just think about all the wasted resources if you don’t optimize your OS and then deploy 200 XenApp server. Even when you don’t use the virtual machine as a XenApp server but just as a normal virtual application server, optimizing the OS for virtual use will increase performance and will make the server leaner. The same can be said when using a Desktop OS as VDI, like Windows 10. So using an optimizer will improve performance.
 The Citrix Optimizer is the newer tool of the two. It is also still in beta just like the VMware tool. You can use the Citrix Optimizer in two ways; through the GUI or through PowerShell. The PowerShell option is great for using the optimizer in your automation workflow. The Citrix Optimizer uses templates to optimize your server. Out of the box it comes with default templates for Windows 7, 8.1, 10, 2008R2, 2012R2 and 2016. At the moment there are no templates for specific functions like application servers or remote desktop servers, etc. Through the GUI you can change settings in the templates by checking boxes. You can save your changes in new templates. The Citrix Optimizer does not have a download section to download more templates and you can’t analyze remote computers through the GUI. The Citrix Optimizer is now integrated into the Citrix Cloud, Smart Checks and with that you are now able to do remote analyzing from the cloud. The description of the Citrix Optimizer from the Citrix website:
“The Citrix Optimizer is a Windows tool to help Citrix administrators optimize various components in their environment, most notably operating system with Virtual Delivery Agent (VDA). The tool is PowerShell based, but also includes a graphical UI.”
Using the Citrix Optimizer:
 |
You can download the Citrix Optimizer here.
Download the Citrix Optimizer as an Ivanti / RES Automation Building Block here.
 The VMware OS Optimization Tool or OSOT is a creation from the VMware Flings Labs and is community driven. The VMware OSOT also uses templates to analyze and optimize your virtual machine. Out of the box it comes with an abundance of templates. There are templates for Windows 7, 8.1 ,10 2008-2012, and 2016. For Windows 2016 and Windows 10 there are more kinds of templates for specific functions available like RDSH, Server, LoginVSI and Horizon Air. The GUI also provides you with History, Remote Analysis and Template management options. There is an option to download public templates from the cloud. The VMware OSOT can be used through command line to add it to your automation workflow but does not support PowerShell. The description from the VMware Flings website:
“The VMware OS Optimization Tool helps optimize Windows 7/8/2008/2012/10 systems for use with VMware Horizon View. The optimization tool includes customizable templates to enable or disable Windows system services and features, per VMware recommendations and best practices, across multiple systems. Since most Windows system services are enabled by default, the optimization tool can be used to easily disable unnecessary services and features to improve performance.”
Using the VMware OS Optimization Tool:
 |
The VMware OS Optimization tool can be downloaded here.
 So now that we have taken a look at the Optimizers it is time to test them. But how do we test the performance of an optimizer? First off we need to think about which test we can do on a virtual environment that uses Citrix and VMware. So I have come up with two test environments: one Citrix XenApp running on VMware and two Citrix XenDesktops running on VMware. First up are the XenApp tests.
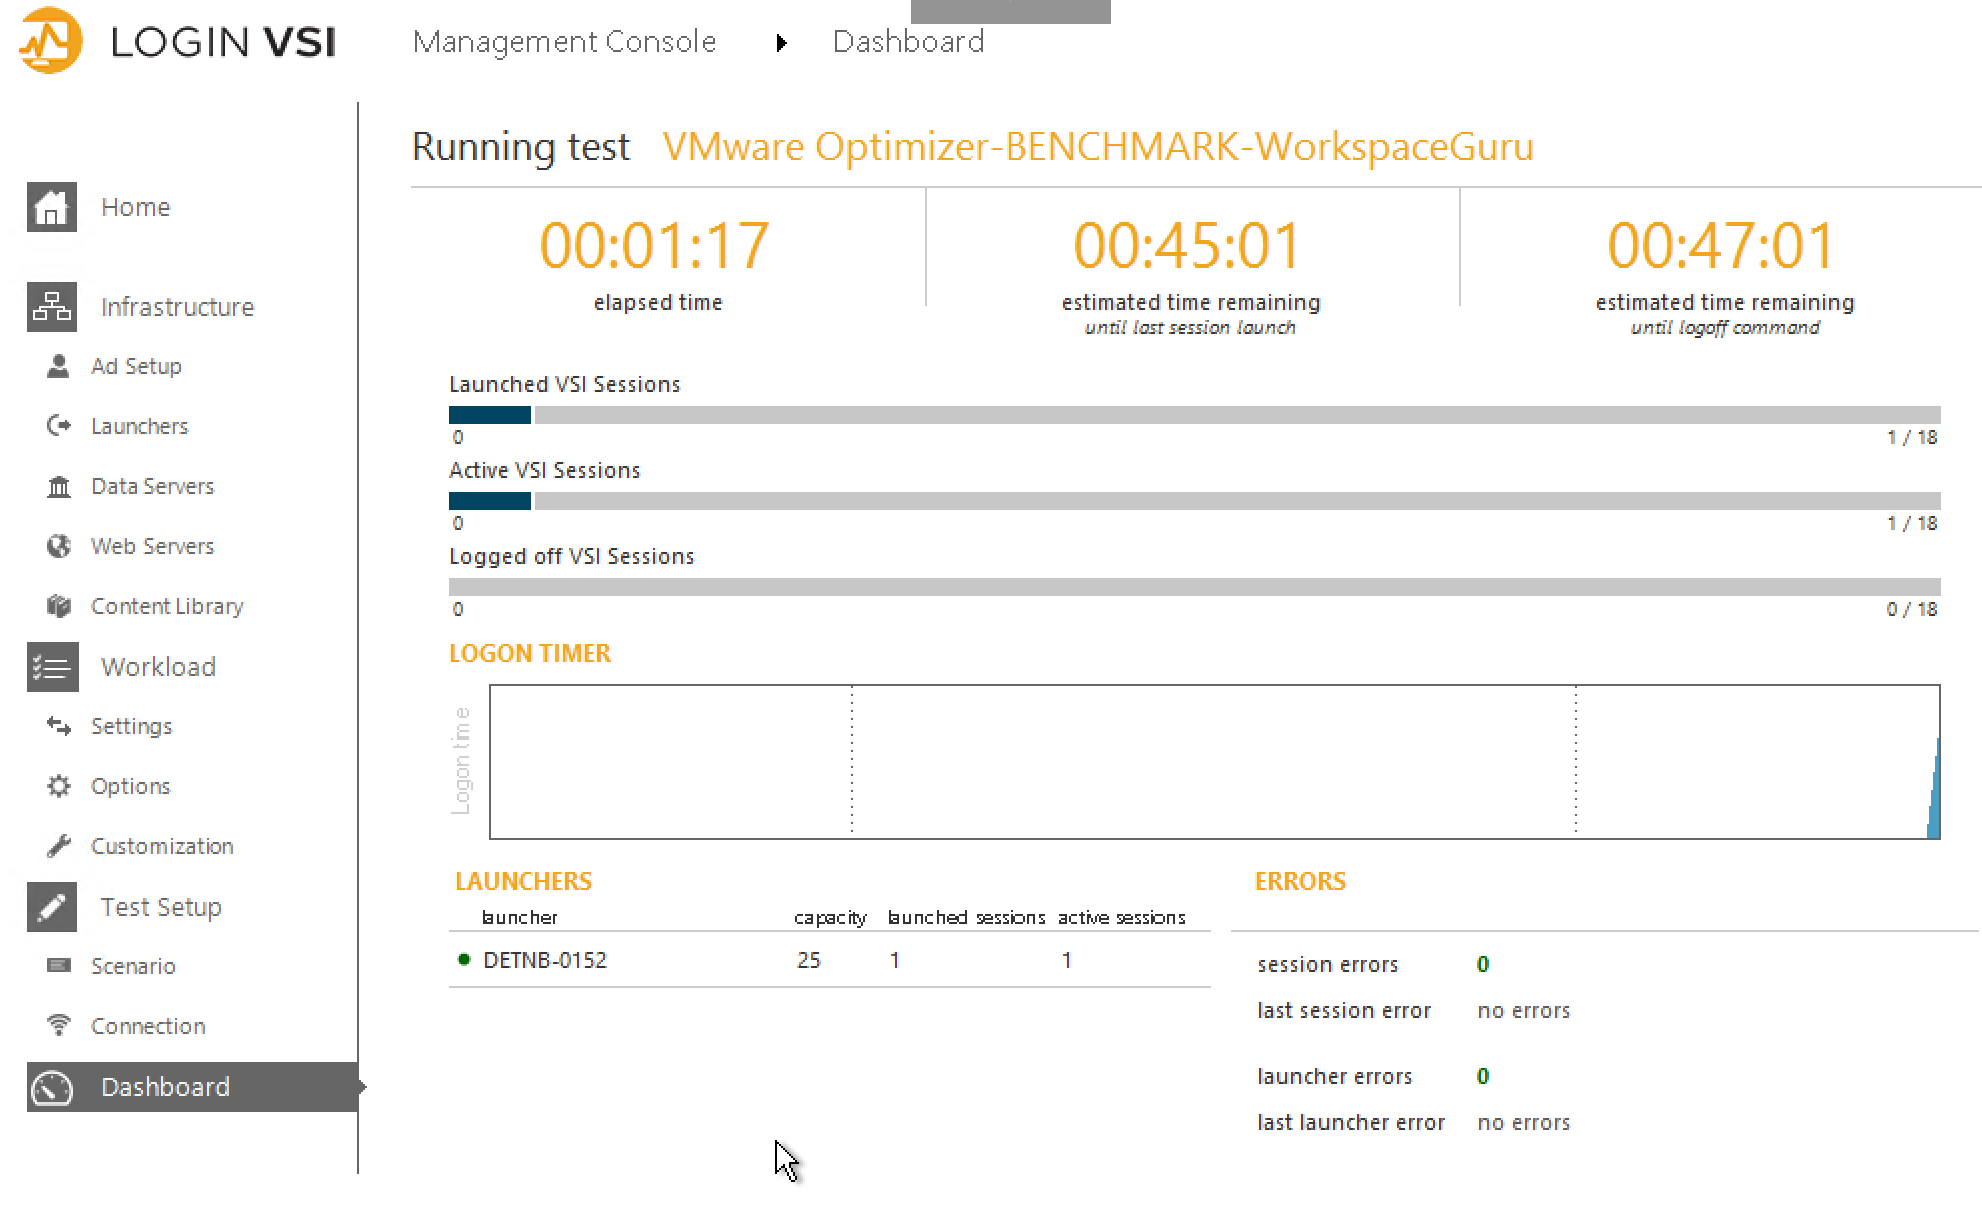
![]() How do we test performance in a XenApp environment? Of course we use Login VSI and Login PI from Login VSI. We can measure the maximum number of users that can work on the XenApp server before performance is degraded. With Login VSI this is called the VSImax. Login VSI also gives us a baseline number. The lower the number, the better the performance. By using Login PI we can measure the applications start and sign in times.
How do we test performance in a XenApp environment? Of course we use Login VSI and Login PI from Login VSI. We can measure the maximum number of users that can work on the XenApp server before performance is degraded. With Login VSI this is called the VSImax. Login VSI also gives us a baseline number. The lower the number, the better the performance. By using Login PI we can measure the applications start and sign in times.
The test VM:
- Windows 2016 server
- 4 vCPU’s at 2,0Ghz Xeon
- 8 GB RAM
- Office 2016
- Citrix VDA 7.15 LTSR
- VMware Esxi 5.5
The test VM was installed from a fresh ISO and all software was installed with Ivanti Automation. After the creation of the test VM, it was cloned two times. So now I had three of the same VM’s. On one of the machines I ran Citrix Optimizer with the default Windows 2016 template. On the second machine I ran VMware OS Optimization tool with the VMware\Windows 2016 – RDSH template. On the third machine I ran no optimizations. Then I started testing with Login VSI in Benchmark mode with a OfficeWorker scenario.
 |
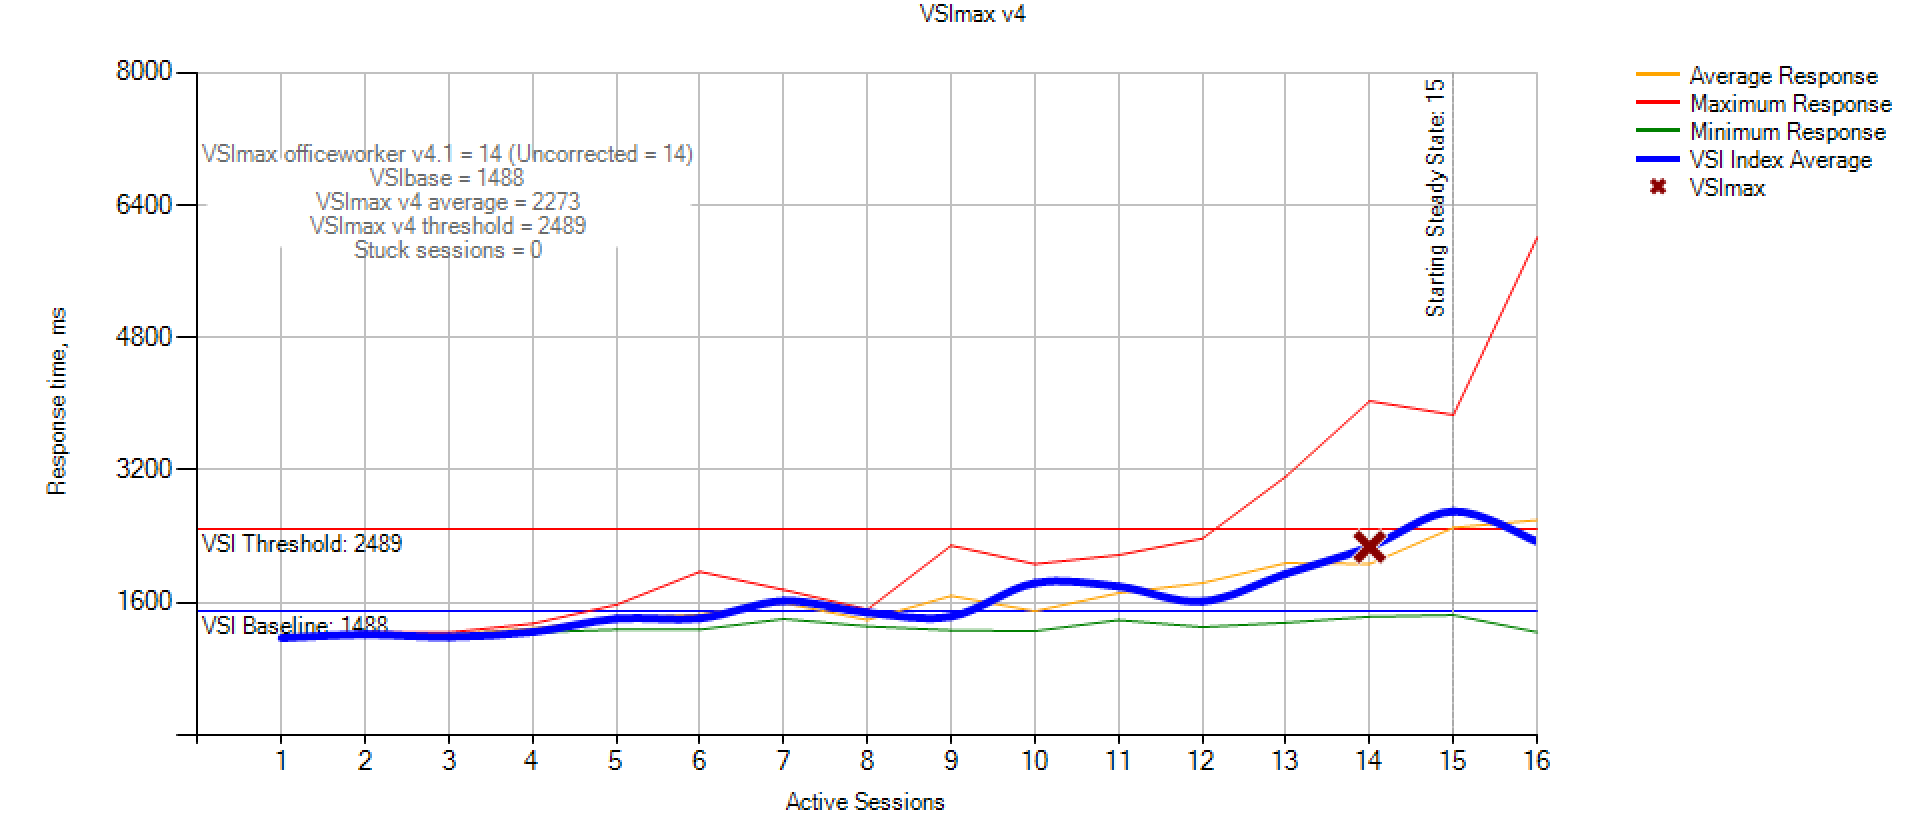
So now the results! First up the VSImax of every machine.
No Optimizer:
 |
Citrix Optimizer:
 |
VMware OS Optimization Tool:
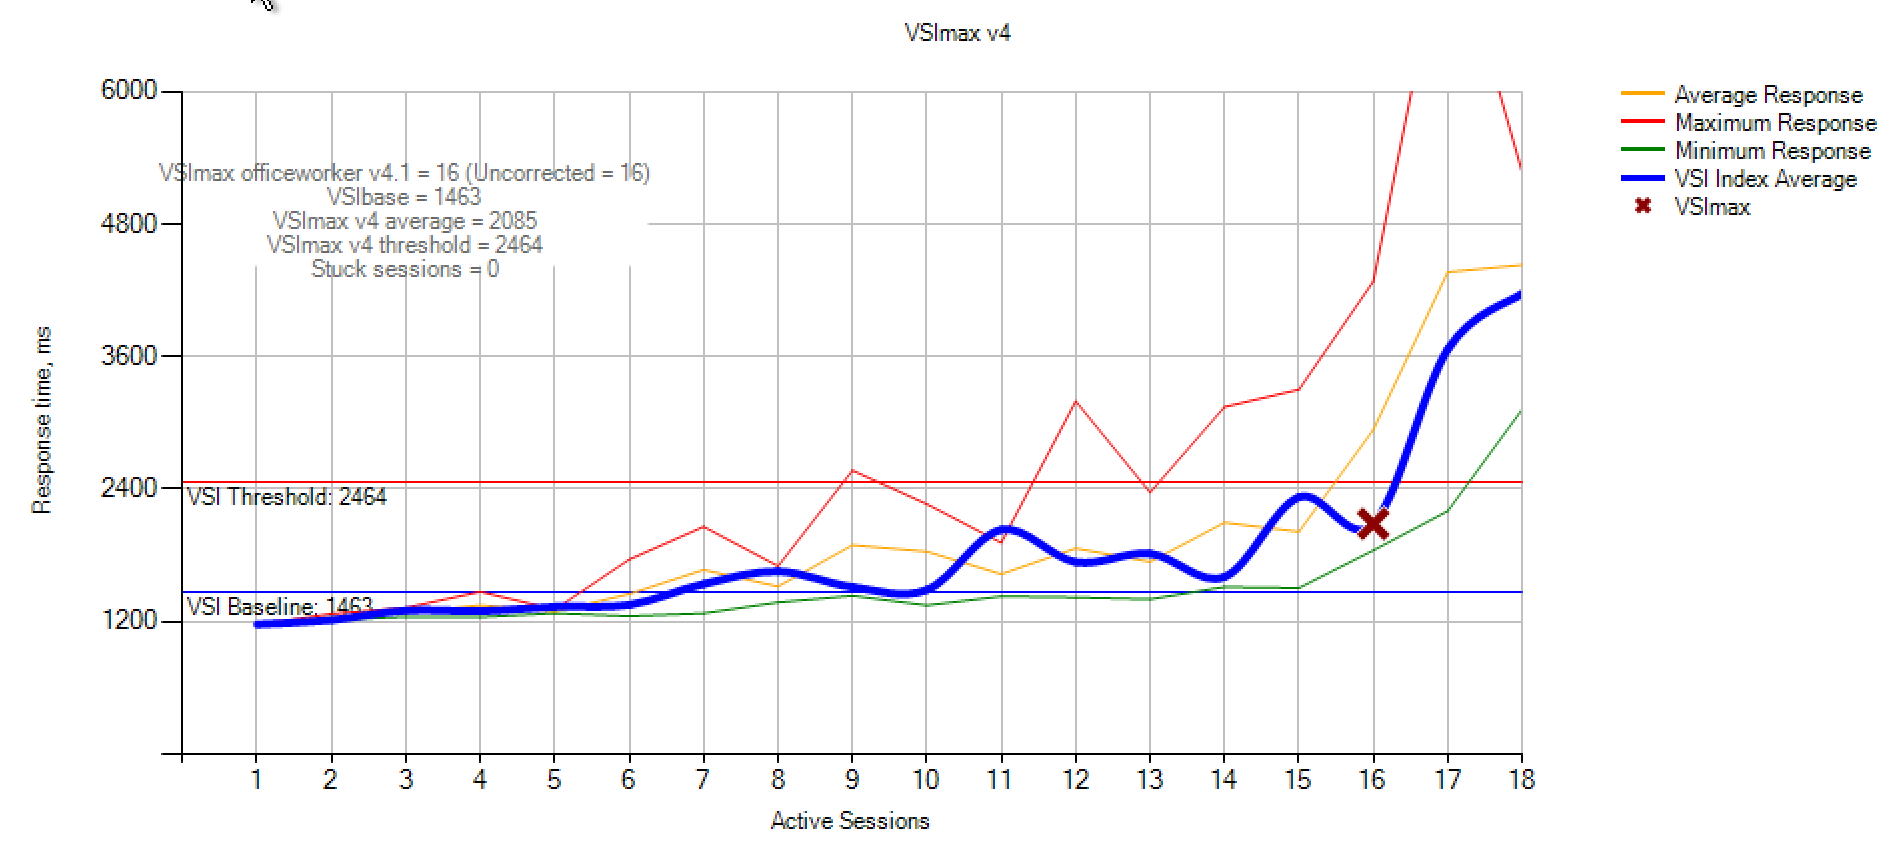 |
Totals Login VSI:
- No Optimizer: 14 VSImax, 1488 Baseline
- Citrix Optimizer: 16 VSImax, 1427 Baseline
- VMware OS Optimization tool: 16 VSImax, 1463 Baseline
This means that after running either optimizers that two extra users can logon to the XenApp server with good performance. So if you need to create an environment for 1000 users you would need 72 XenApp servers (with the same performance) when not running an optimizer, and 63 XenApp servers (with the same performance) with optimizers. Thats a saving of 9 XenApp servers or 9 x 4 vCPU = 36 vCPU and 9 x 8 GB = 72 GB of RAM.
Now the login PI results. Here we looked at the sign in time and the time to open certain applications.
No Optimizer:

|
Citrix Optimizer:
|
VMware OS Optimization Tool:
|
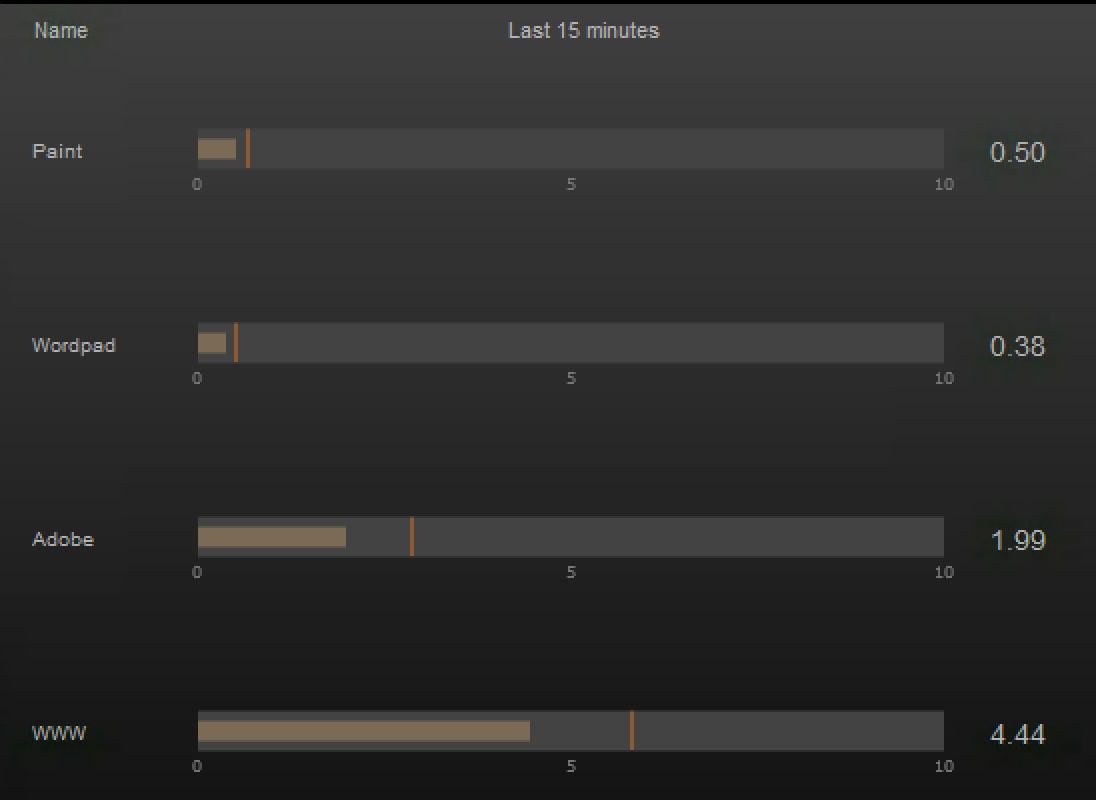
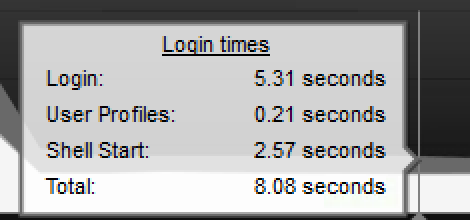
Totals Login PI:
- No Optimizer:
- 5,55 Seconds sign on speed.
- 0.50 Second open Paint
- 0.38 Second open Wordpad
- 1,99 Second open PDF
- 4,44 Second open Web
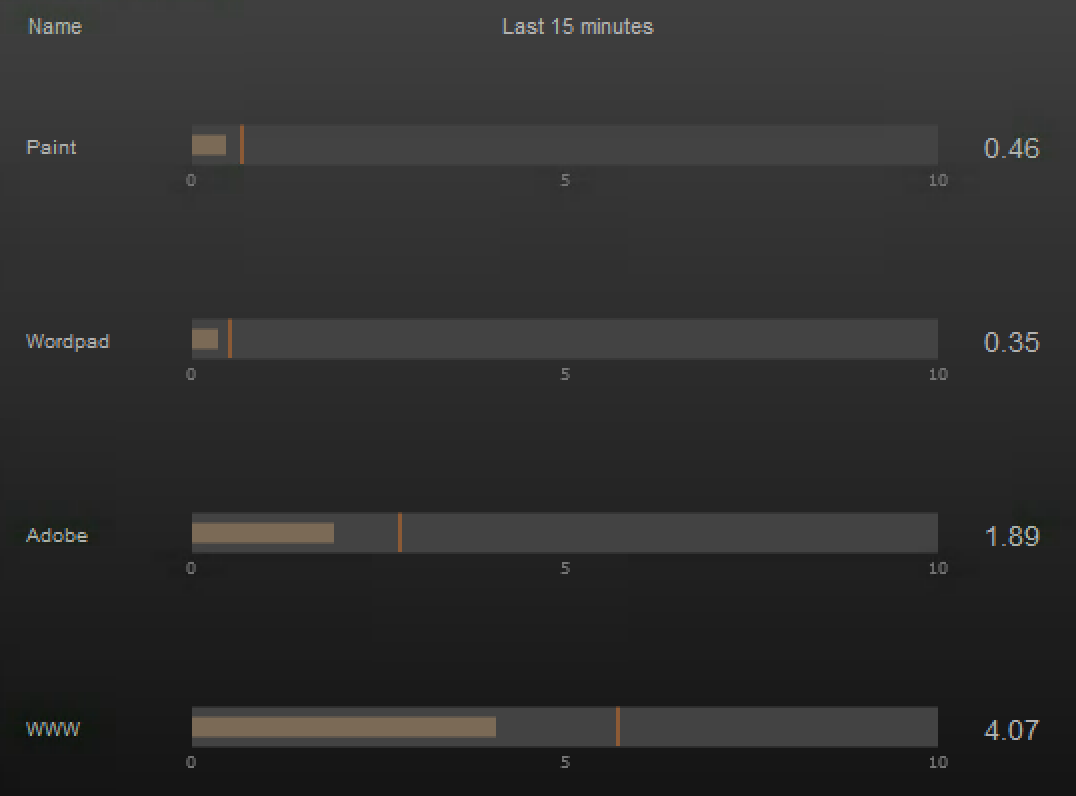
- Citrix Optimizer:
- 5,31 Seconds sign on speed.
- 0.46 Second open Paint
- 0.35 Second open Wordpad
- 1,89 Second open PDF
- 4,07 Second open Web
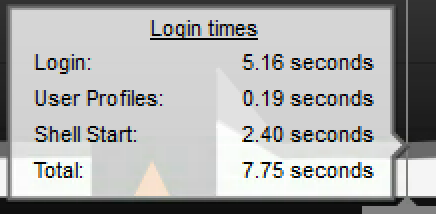
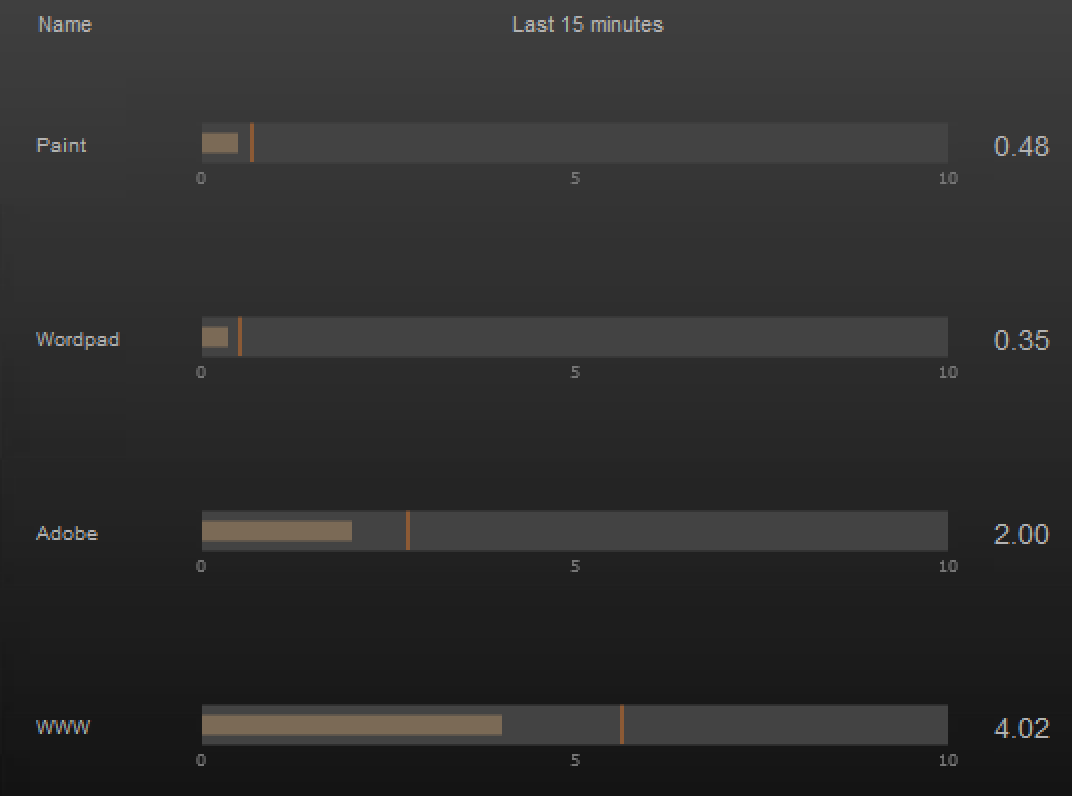
- VMware OS Optimization tool:
- 5,16 Seconds sign on speed.
- 0.48 Second open Paint
- 0.35 Second open Wordpad
- 2,00 Second open PDF
- 4,02 Second open Web
The results indicate that the VMware OS Optimization tool makes logons faster by 0.39 seconds compared to no optimizer. This is probably because the VM OSOT removes the background image from the sign in and optimizes this process. The Citrix Optimizer shaves off 0.24 seconds from the sign in process. In the application test it’s a mixed result, with both Citrix and VM OSOT performing better than no optimizer and depending on application better than the other optimizer.
For the XenDesktop (VDI) tests I ran into a little snag. I don’t have enough resources at the moment to do a good XenDesktop (VDI) test with Login VSI, so no Login VSI VSImax numbers. But I had a new idea. I wanted to see how much RAM it would save to Optimize your VDI and how fast the logins are. So I created the following three VM’s.
The three test VM’s:
- Windows 10 1703
- 2 vCPU
- 4 GB RAM
- Office 365 pro plus
- Citrix VDA 7.15
- VMware ESXI 5.5
The test VM’s were all created with the same template and the software was installed with Ivanti / RES Automation. The first VM was left untouched, on the second I ran Citrix Optimizer with Default Windows 10 1703 Template and on the third I ran VMware OSOT with the default VMware – Windows 10 template. I did two tests; one, I logged on with a new user without profile and measured the login time from welcome to the appearance of the network symbol. I timed this with screen recording. And two, after I logged on I left the VM alone for 5 minutes to see how much RAM it uses.
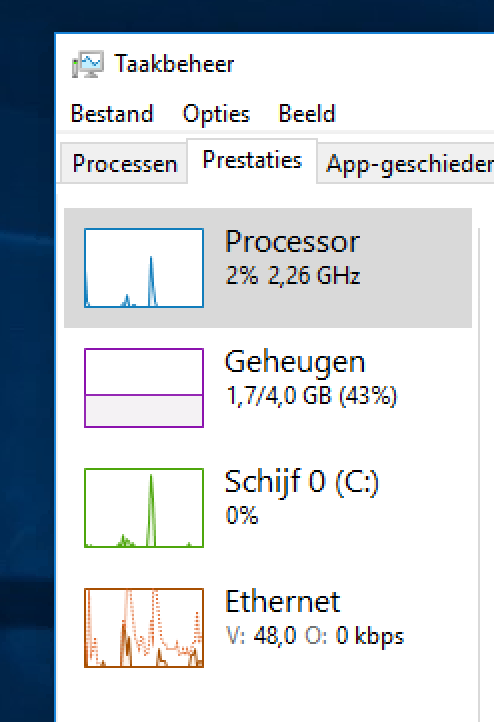
The RAM test results
No Optimizer:
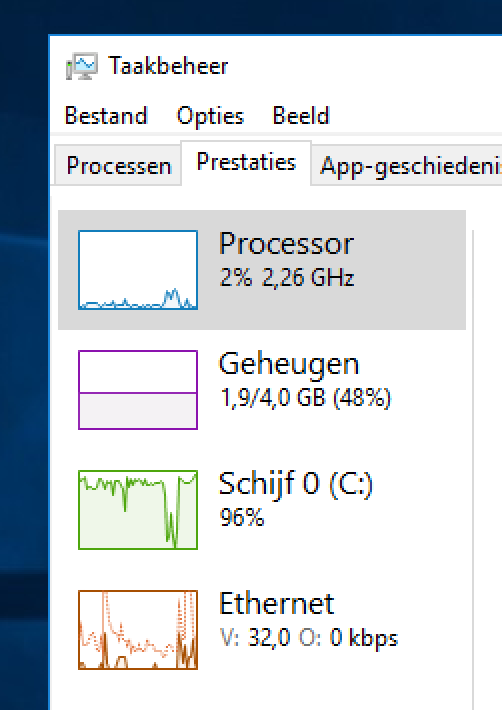 |
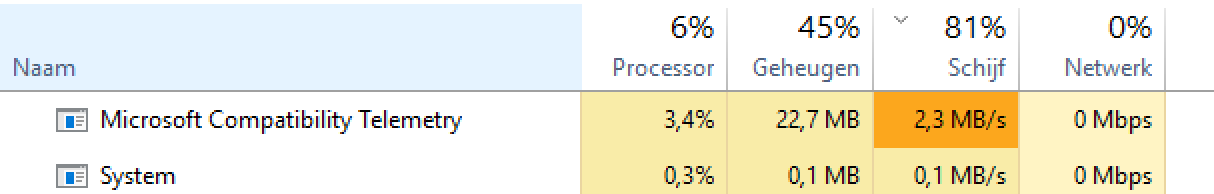
Even after 5 minutes running the disk was still busy with Microsoft Compatibility Telementry:
Citrix Optimizer:
 |
VMware OS Optimization Tool:
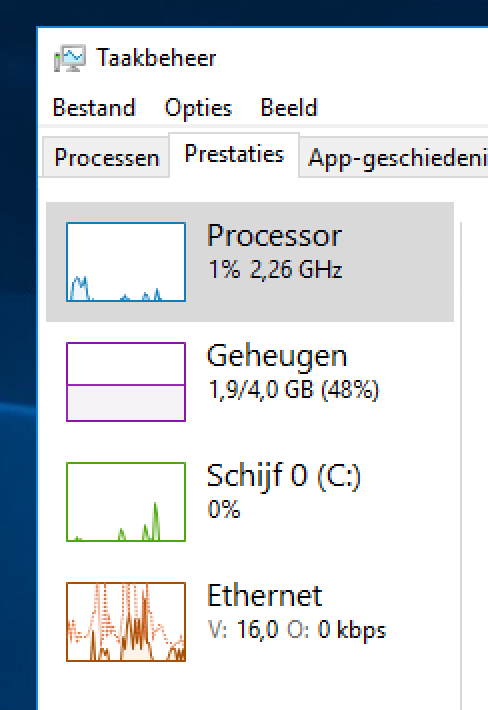 |
Sign on speeds:
- No Optimizer – 34 Seconds
- Citrix Optimizer – 30 Seconds
- VMware Optimizer – 23 Seconds
If we look at these results it’s clear that Citrix Optimizes the RAM more than VMware OSOT, but VMware OSOT optimizes the logon process more. This is in line with the XenApp results.

The last question that came to my mind was; why not use them both? I do use VMware ESXI and Citrix XenApp/XenDesktop together in the test environment, so why not both optimizers? Well, hold on to your hats because I did some tests with running them both. The first test I ran was Login VSI on XenApp with first running the VMware OSOT with Windows 2016 – RDSH template and then running Citrix Optimizer with Windows 2016 template.
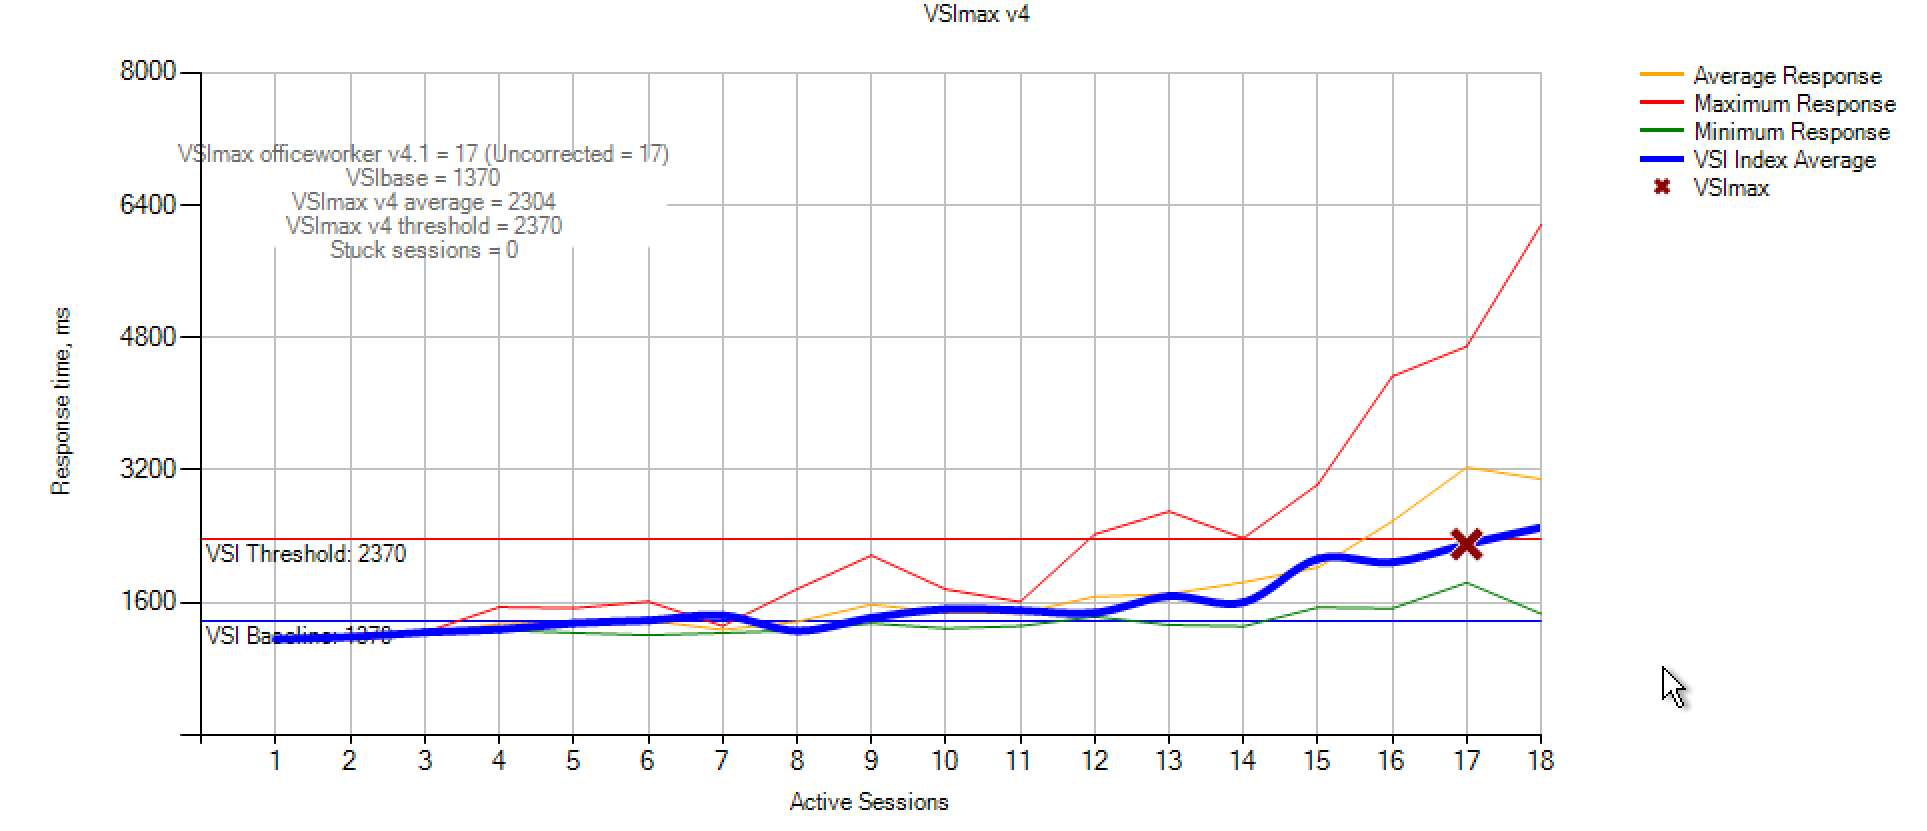 |
The result is great ! I now reached a new VSImax of 17 users. This means that by running both optimizers on a system of 1000 users we would only need 58 XenApp servers (with the same performance) instead of 62 with only one optimizer.
Login PI test with both optimizers:
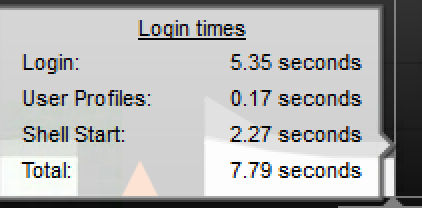
|

Here we see no improvement with the Citrix Optimizer alone.
XenDesktop test with both optimizers:
After the XenApp test I launched the Windows 10 VM, that was Optimized with the default VMware\Windows 10 – Template, and I ran the Citrix Optimizer with Default Windows 10 1703 Template. And I performed the RAM and sign in speed tests again.
 |
Here we see that running both optimizers saves you 100 MB of RAM over running only the VMware OSOT. The sign in speed for the VDI was 25 seconds, so around the same as running only the VMware OSOT.
 Both optimizers work as promised. They optimize the system and improve performance. And which one to use is of course up to you. VMware OSOT has more bells and whistles, while Citrix Optimizer has PowerShell. As you can see in the test when using VMware ESXi and Citrix XenApp/XenDesktop together, you could also use both optimizers and get an even better performance. Be mindfully that both products are still Beta, so always test before using in production!
The scoreboard:
Citrix Optimizer
![]() PowerShell based
PowerShell based
![]() Clean GUI
Clean GUI
![]() Great RAM and CPU-optimization
Great RAM and CPU-optimization
![]() Better VSI baseline
Better VSI baseline
![]() Integrated into Citrix Cloud Smart Checks
Integrated into Citrix Cloud Smart Checks
![]() No way to download and share templates build-in
No way to download and share templates build-in
![]() No remote analyze capabilities in GUI (Is available through Smart Checks)
No remote analyze capabilities in GUI (Is available through Smart Checks)
![]() No templates for different server functions
No templates for different server functions
VMware OS Optimization Tool
![]() Share and download templates from GUI
Share and download templates from GUI
![]() Templates for different Server function
Templates for different Server function
![]() Faster sign- in speeds
Faster sign- in speeds
![]() Remote analyzer build- in
Remote analyzer build- in
![]() No PowerShell but automation through command -line
No PowerShell but automation through command -line
![]() GUI a bit cluttered
GUI a bit cluttered
I hope this was informative. For questions or comments you can always give a reaction in the comment section or contact me:

Hello Chris,
First of all, really awesome blog post! One small Citrix Optimizer feature that is missing in your list (and can actually provide remote analyze capabilities, among other things) is integration with Smart Tools. Optimizer checks are included in Smart Check now, which is especially useful if you have a farm of standalone XenApp servers.
I agree that ability to download/share other templates is very important and it’s actually going to be our focus for the next version. The vision behind Optimizer has always been to build a community-driven framework and we are planning to keep working on this vision in the upcoming releases.
Thanks for your great work!
Martin and Team Optimizer
Thanks for sharing! Awesome that it now also part of smart checks in Citrix Cloud is! You guys did a great job with the tool!
*Changed the post accordingly.
Very good blog
Great article, thanks for sharing your results.
In another layer, tools like WEM could add performance improvements results beyond OS Optimizations.
https://www.citrix.com/blogs/2017/06/28/with-wem-take-your-xenapp-xendesktop-environment-to-eleven/
https://www.christiaanbrinkhoff.com/2017/06/09/how-to-configure-citrix-workspace-environment-management43-for-xenapp-or-xendesktop/
I would love to try both of them to make my users productive and happy!
Yeah thats right I think that CPU optimization and RAM optimization from Ivanti / RES ONE Workspace will also make a big difference. Maybe a blog for the future 😉
Chris – Great blog post and initiative to test each Optimizer AND both together. Greet thinking!
Hi, and thanks for a great article! I have run Citrix Optimizer in a XenApp 7.15 Windows Server 2012 R2 RDS-host environment, and discovered that two essential services for running App-V 5 Client is disabled: Network List Service and Network Location Awareness. Just to hopefully save others unneccessary hedache 🙂 Didn’t take long to figure i\out, but still…
Should of course spell “headache”…
My brother recommended I might like this blog. He was entirely right.
This post actually made my day. You cann’t imagine just how much
time I had spent for this info! Thanks!