Why quick troubleshooting and self-healing automation are essential in a Citrix environment.
By Chris Twiest, Citrix CTP
Citrix environments can be highly complex with multiple back-end components like Storefront, Netscalers, Delivery Controllers, FAS, License servers, Cloud Connectors, and databases. And the front end can be equally complex with VDA’s running in different parts of the world and the cloud and on-premises hybrid. With all this complexity, it’s essential to have the correct troubleshooting, monitoring, and self-healing automation tools. This blog will look at the Goliath Technologies monitoring tools to help quick troubleshooting, monitoring, and self-healing automation.
The slogan of Citrix is, of course, to work everywhere and from any device. This made Citrix solutions a great match during the pandemic. People could stay safe and work from home without missing a beat. Now that the pandemic is mostly over, most people still want to work (part-time) from home. This is still possible, but we see one issue often coming back to the IT helpdesk; this issue is, of course, latency. When users experience latency issues, their session feels sluggish, they type words in the Citrix session, and the letters appear delayed on the screen. Dragging and dropping in the session do not work well due to the delay. This comes because, unlike in the office, the IT department does not control the internet connection in the end-user’s home. So, the quality of this connection is up to the end user. You can imagine if an end user is working from home in the attic on the Wi-Fi while the kids at home are streaming online video games and watching Netflix, the situation is not ideal.
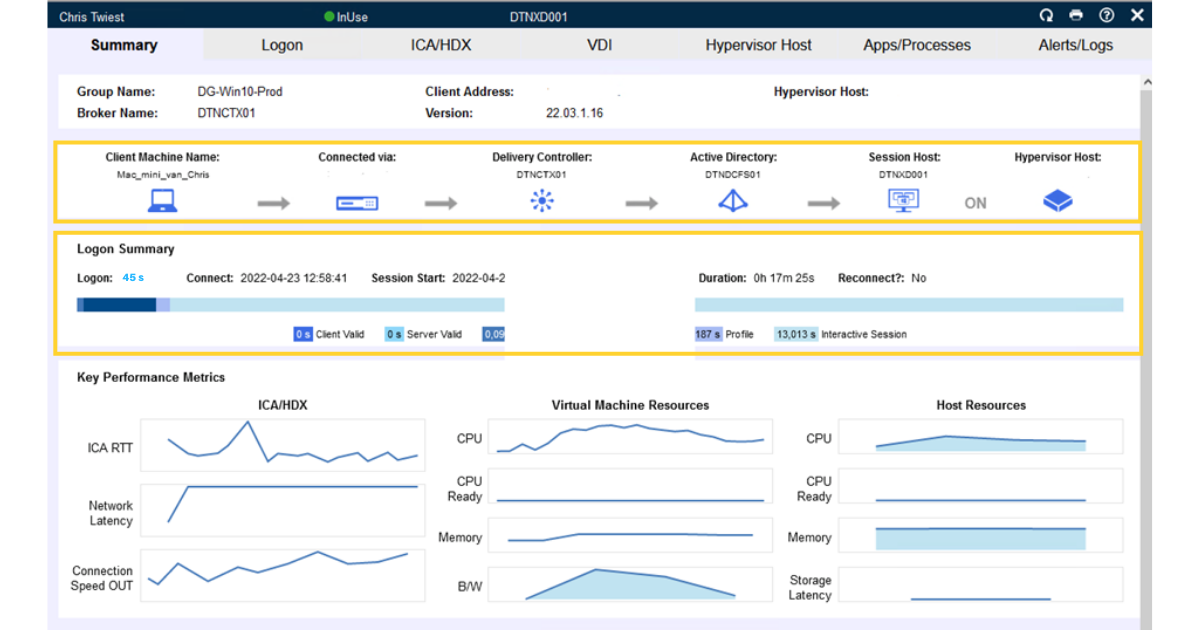
The problem might sometimes be hard to diagnose for IT when end users say their session is sluggish, slow, and unresponsive. The problem can also be the performance on the VDA or a bottleneck in the internal network. How can we quickly troubleshoot this issue? With Goliath, we can view the network connection of the end user. If we click on a user session, we can immediately see a session summary that includes the user’s path to connecting with the session, logon time, and key performance metrics, as seen below.
If we now click on network latency from this screen, we can see the session network latency directly. One of the cool things about the Goliath Technologies tool is the inclusion of Caution and Critical Warning indicators directly on the graph, as seen below.

This way, you can diagnose super quickly if network latency is the issue. These threshold interpretation lines or Caution and Critical warnings are available for all key metrics so the user doesn’t need to be a Citrix expert to understand the data.
Now, if we dive deep into the network connection further, we can click on ICA/HDX, and there are more easy-to-read graphs.
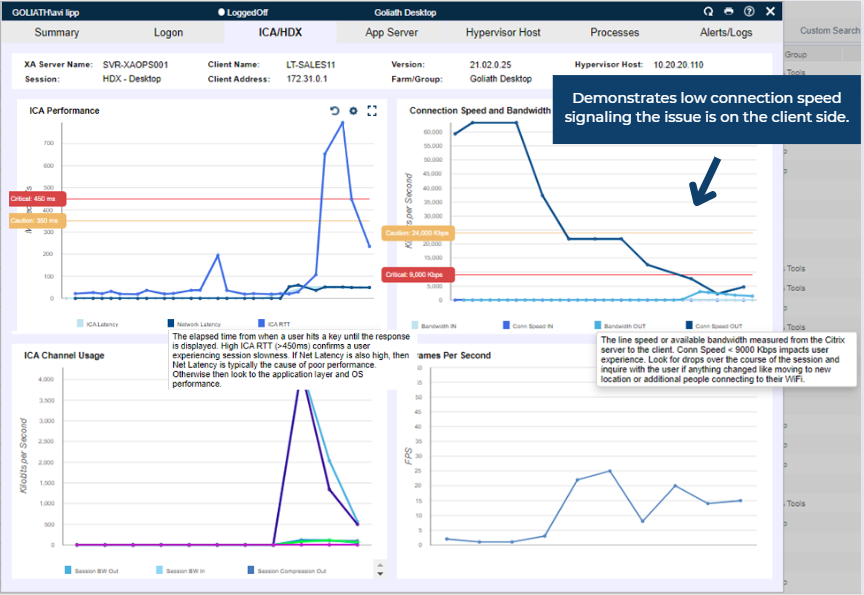
The top right Graph, for example, shows how many KBs an end-user has available for the Citrix connection. With this, you can quickly diagnose if the internet connection on the end-user side can deliver a good performing Citrix session. In the image above you can see that connection speed is low and the issue is therefore on the client side.
The Graph on the bottom left (ICA Channel Usage) is my absolute favorite network graph in the Goliath Technologies solution.
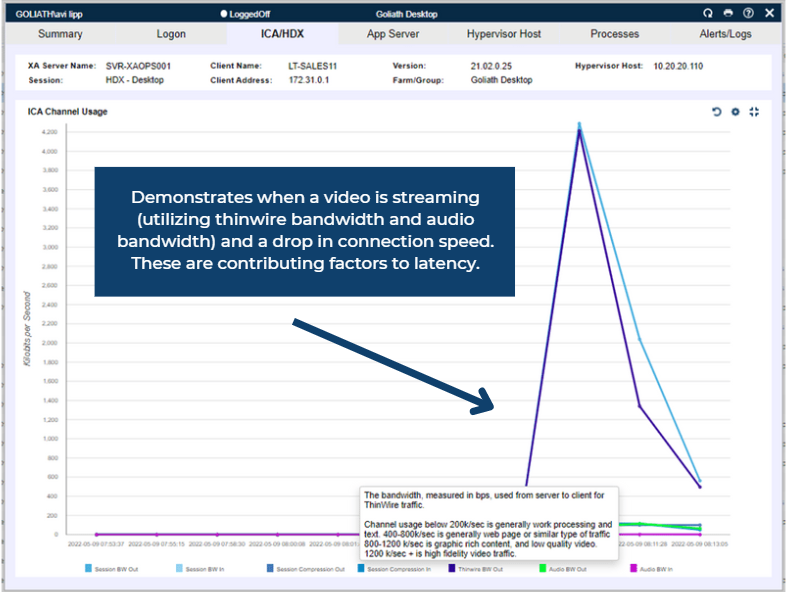
With this Graph, you can see exactly where the session uses the bandwidth and with the data interpretation lines you can see the user is over the critical threshold. For example, in this Graph, you can see now where there is a lot of usage on the Thinwire BW out. The end-user is streaming a YouTube video over the Thinwire connection and this is taking up most of the bandwidth and the cause of session slowness. But you can also easily see how much data is used for printing, audio, data redirection, etc. This gives you a good insight into the user’s ICA session from a network perspective.
The Goliath Technologies ICA and network monitoring tools help you quickly troubleshoot end-user connection troubles and are the first step in the solution to good performing Citrix sessions.
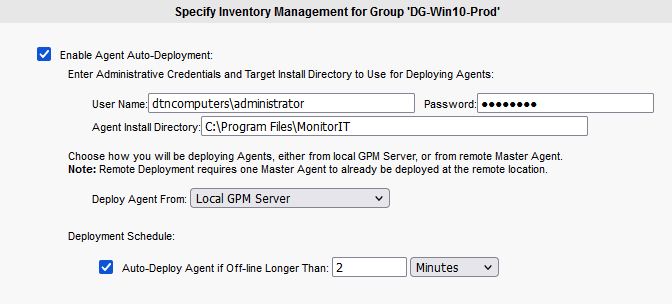
A big part of keeping a sound, well-performing Citrix Environment is preventing problems before they arise. We can do this with self-healing automation and fix an issue before it becomes a problem. Goliath Technologies also has some great features for this. One of my favorites is the automatic deployment of Goliath Agents to non-persistent VDAs. This allows you not to edit your golden image but have the monitoring tool push agents to the VDA after they have lost contact for x minutes. If the non-persistent image is rebooted and the agent is gone, it will automatically get an agent again. This means that the agent is self-healing.
Goliath comes out of the box with many Citrix monitoring rules, and more can be loaded in directly from the console. From these rules, we can add self-healing automation. For instance, if we look at the “Citrix Delivery Controller – Broker Service” rule, it has the feature to attempt service restart if the service fails.

If the broker service fails on the delivery controller, Goliath will automatically try and self-heal this service by restarting it.
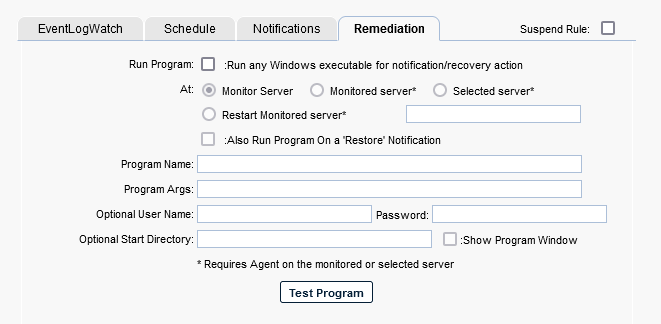
But, of course, not everything we monitor is a service that needs a restart. This is where the Remediation Tab comes in. This allows you to run a program or script (powershell.exe) when the rule gets triggered. For example, if a disk is running low on free space, you can have Goliath start a PowerShell script that will remediate the problem by running a disk cleaner and removing files from temp folders. You could even create a script that extends the disk size in the hypervisor. It’s all about catching a warning before it becomes critical and you get downtime.
Your Citrix environment will become more stable and deliver a better end-user experience with the correct troubleshooting and self-healing automation tools!
These were just a few of the great features of the Goliath Technologies monitoring tool. The tool can also give you insight into application availability with active probing, giving you direct insight into your system’s uptime and letting you catch an issue before the end user notices them. With the Goliath Topology feature, you get a straightforward overview of your complete Citrix environment, and it directly shows where an issue might arise within your environment. We will go into more of the Goliath features in a following blog.
I hope this was informative. For questions or comments, you can always leave a reaction in the comment section or contact me:
